GETHER
A Generative Emission Temporal Hybrid Explainable Regression Framework
A human-centered AI system for air pollution understanding, forecasting, and policy simulation. GETHER combines temporal deep learning, causal discovery, counterfactual reasoning, and explainable AI to help researchers, policymakers, and the public understand how emissions affect AQI (Air Quality Index) and what interventions could improve it ; Unlike conventional forecasting models that only predict AQI values, GETHER enables users to understand why pollution levels change, which pollutants contribute most, and how hypothetical emission reduction policies would affect future air quality.
Repository
The complete implementation is available on GitHub.
Architecture
Air pollution prediction alone is not enough. GETHER focuses on understanding pollution, not just predicting it.
The system answers questions like:
- What pollutants cause AQI spikes?
- What happens if emissions are reduced?
- Which environmental factors matter most?
- How reliable are model predictions?
- The platform integrates data infrastructure, machine learning, explainability, and policy simulation into a single research pipeline.

Pipeline Overview
| Phase | Work Performed |
|---|---|
| Phase 1 — Data Infrastructure & Validation | • Satellite and weather data acquisition •Weather API integration • Raw data storage and preprocessing pipeline • Feature engineering using lag features and rolling statistics • Train / Validation / Test data split • Automated data quality validation reports |
| Phase 2 — Baseline Modeling | Baseline models provide the initial performance benchmarks for evaluating the forecasting pipeline. Models Used: • top k - cluster • Random Forest • Advance LSTM 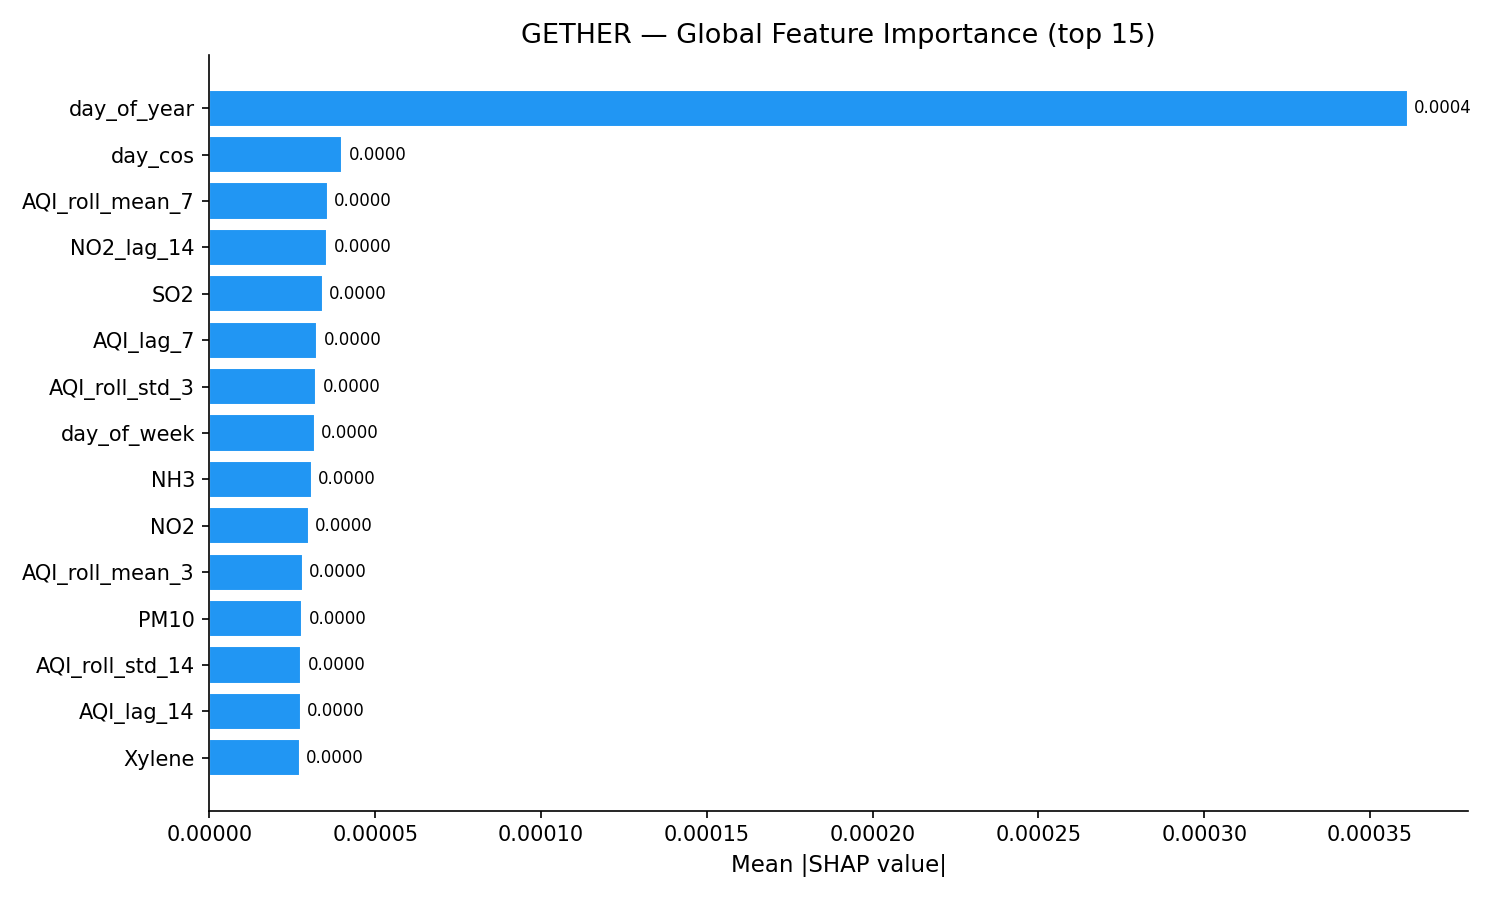 Outputs: • Model comparison • Error analysis • Feature importance |
| Phase 3 — Advanced LSTM Development | The final forecasting system employs a deep stacked LSTM architecture for temporal AQI forecasting. Architecture: Input Sequence ↓ LSTM (128) ↓ Dropout ↓ LSTM (64) ↓ Dense (32) ↓ AQI Prediction Enhancements: • Rolling statistical features • Lag feature engineering • Bayesian hyperparameter tuning • Model averaging (ensemble forecasting) |
| Phase 4 — Causal Discovery Engine | The causal discovery module identifies cause-and-effect relationships between atmospheric pollutants and AQI using statistical inference and graph-based modeling. Objective: Discover how individual pollutants influence air quality over time. 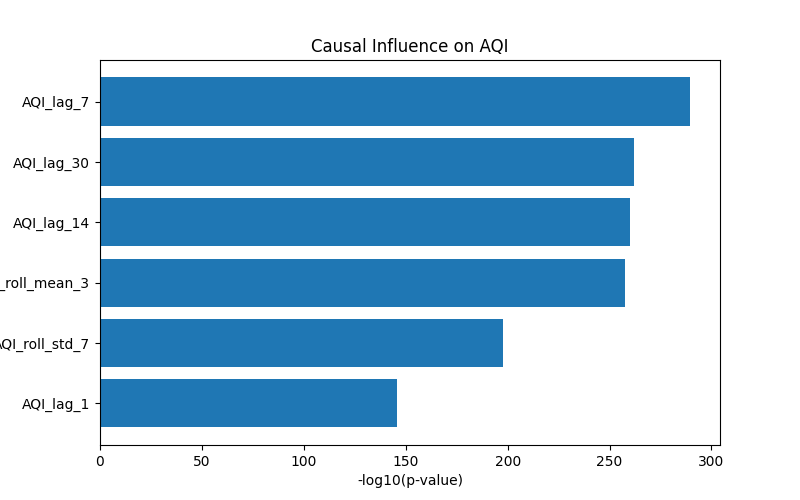 Techniques Used: • Granger Causality Testing • Spatial Correlation Analysis • Dynamic Causal Graph Construction Outputs: • PM2.5 → AQI • NO₂ → AQI • SO₂ → AQI |
| Phase 5 — Explainable AI & Uncertainty | The explainability module enhances model transparency by providing interpretable predictions and estimating forecast reliability, enabling researchers and policymakers to make informed environmental decisions. Explainability: • SHAP-based global feature importance • Local explanation of individual AQI predictions • Model transparency and interpretability 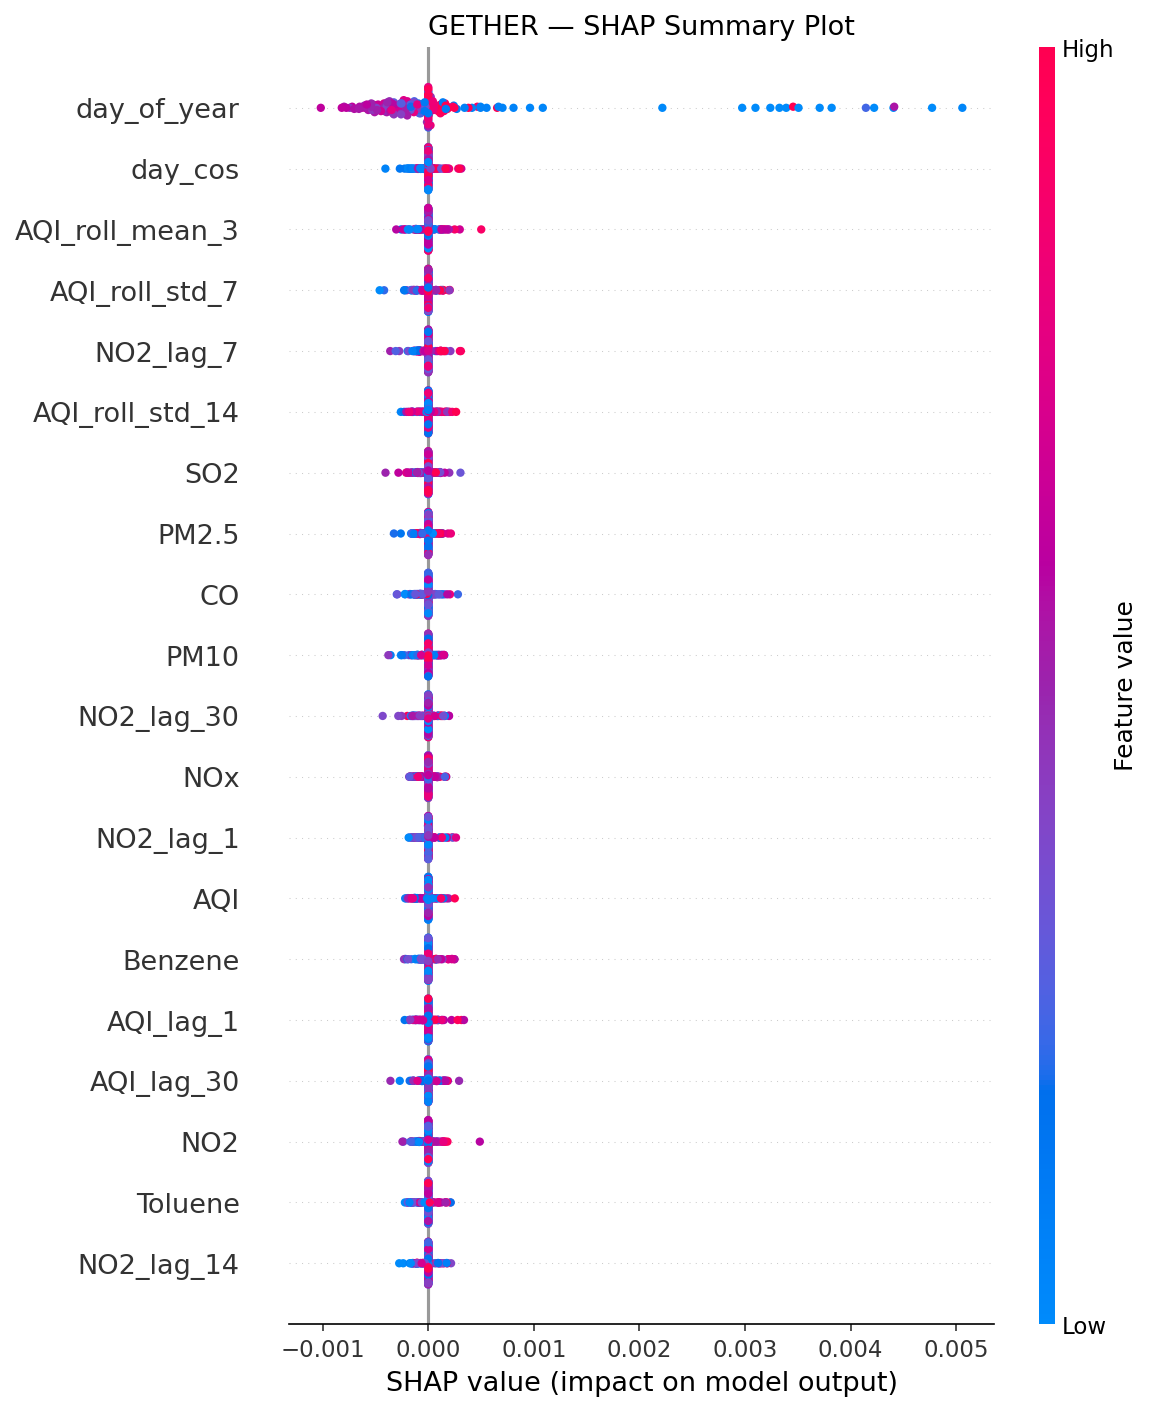 Uncertainty Estimation: • Confidence interval estimation • Prediction stability analysis • Model reliability scoring 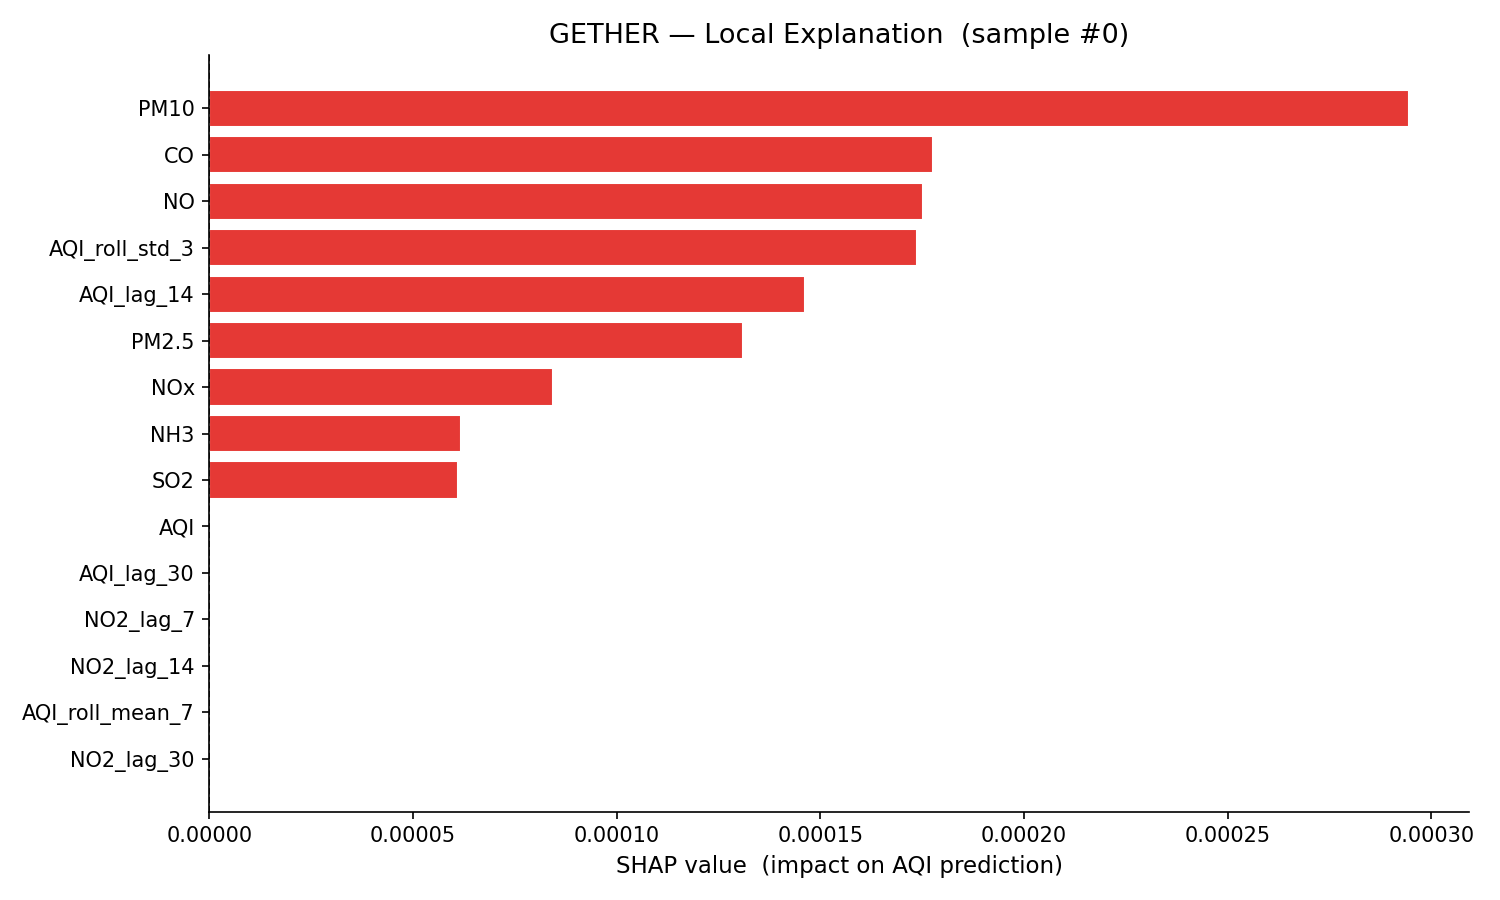 Outputs: • Automated explainability reports • Feature contribution visualizations • Decision-support reports for researchers and policy analysts |
| Phase 6 — Counterfactual Policy Simulator | The counterfactual simulation engine enables researchers and policymakers to evaluate the potential impact of environmental interventions before implementation. By modifying pollutant emission levels, the system forecasts corresponding AQI changes, allowing evidence-based policy assessment and decision making. Example Simulation: • Policy: Reduce NO₂ emissions by 25% • Baseline AQI Forecast: 210 • Counterfactual AQI Forecast: 168 • Estimated AQI Improvement: 20% Policy Evaluation Metrics: • Emission reduction achieved • Predicted AQI improvement • Overall environmental impact assessment • Comparative ranking of alternative policy interventions |
| Phase 7 — Dashboard Deployment | The final system is deployed as an interactive web application that enables researchers, environmental agencies, and policymakers to monitor air quality, explore causal relationships, evaluate intervention strategies, and interpret model predictions through an intuitive interface. Dashboard Features: • Interactive AQI forecasting and visualization • Dynamic causal graph exploration • Counterfactual policy simulation interface • SHAP-based explainability and feature importance reports • Automated analytics and decision-support reports Technology Stack: • Streamlit • TensorFlow • SHAP • Scikit-learn |